Google Analytics
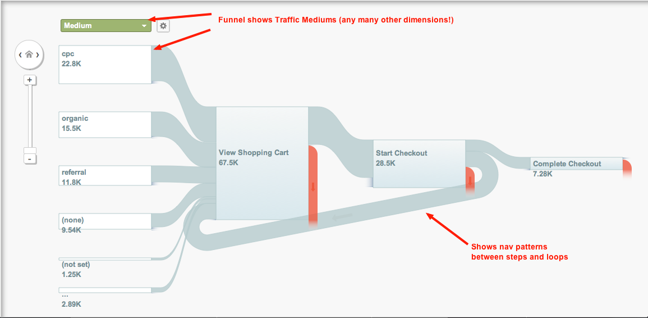
This is the capstone of web analytics tools. I have used this for YEARS and it keeps getting better. One of my favorite visualizations is the user flow.

Learn more about Google Analytics
SiteCat now Adobe Analytics
Omniture Site Catalyst was bought out by Adobe and is now called Adobe Analytics. I worked with a REALLY talented SEO guy who showed me a lot of powerful things that SiteCat could do! As a UX or Marketing person, it is great to be able to baseline and then compare after a site layout or process is changed. It also would help validate items that were screen clutter and NOT being used on a page or section.
Learn more about Adobe Analytics
Qualtrics
At the University I was the survey administrator and used a tool called Select Survey. I had trained 100s of faculty to use it so I was reluctant to switch to a new tool. A few professors in the Marketing Department in the College of Business really wanted to use Qualtrics. I set up a 50 user license to test it out. It blew me away with how easy it was to use. I also had the opportunity to use this a bit with our primary research gathering in a corporate setting.
Clarabridge
I did not administrate Clarabridge but used it for client experience dashboards and insights. I worked with a GREAT team that would build customer dashboards and do monthly reports and breakout analysis sessions with my quality assurance team.
Tableau
I wish I would have had more time to play with Tableau. It seems I would get a basic dashboard set up and not get the time to make it even more robust. My basic usage was to have data fed into an Excel sheet or a SharePoint list and then feeding it to a dashboard and displaying it in a usable manner. The tool can certainly do a LOT more than what I used it for.
PowerBI
This tool is super cool! I have done only the most basic processes. I have a colleague who was able to create a connection from her Forms item, have that put an alert on a Teams channel, have it add an intake item on her Planner board, and assign the task to people based on the fields selected in the form. Wow! She shared her flow with me but I am still looking for the time to perfect it for my needs.
Social Media Analytics
My talented colleagues at Illinois State University set up the Social Media Analytics Command Center (SMACC). Very few universities have a facility set up like this. I brought multiple tours from my existing teams in my corporate roles to see this HIGHLY useful tool and to give kudos to this center as an educational experience.
Here is an excerpt from their website: “Students, faculty, and researchers use the SMACC to identify public conversation from major social media platforms such as Facebook, Twitter, and Instagram, popular discussion forums, major blogs, and online news sources. Using specialized software they can then analyze these conversations for key data such as top influencers, trending keywords and concepts, audience metrics, geographic location of posts, user sentiment, and share of voice in the social web.”
